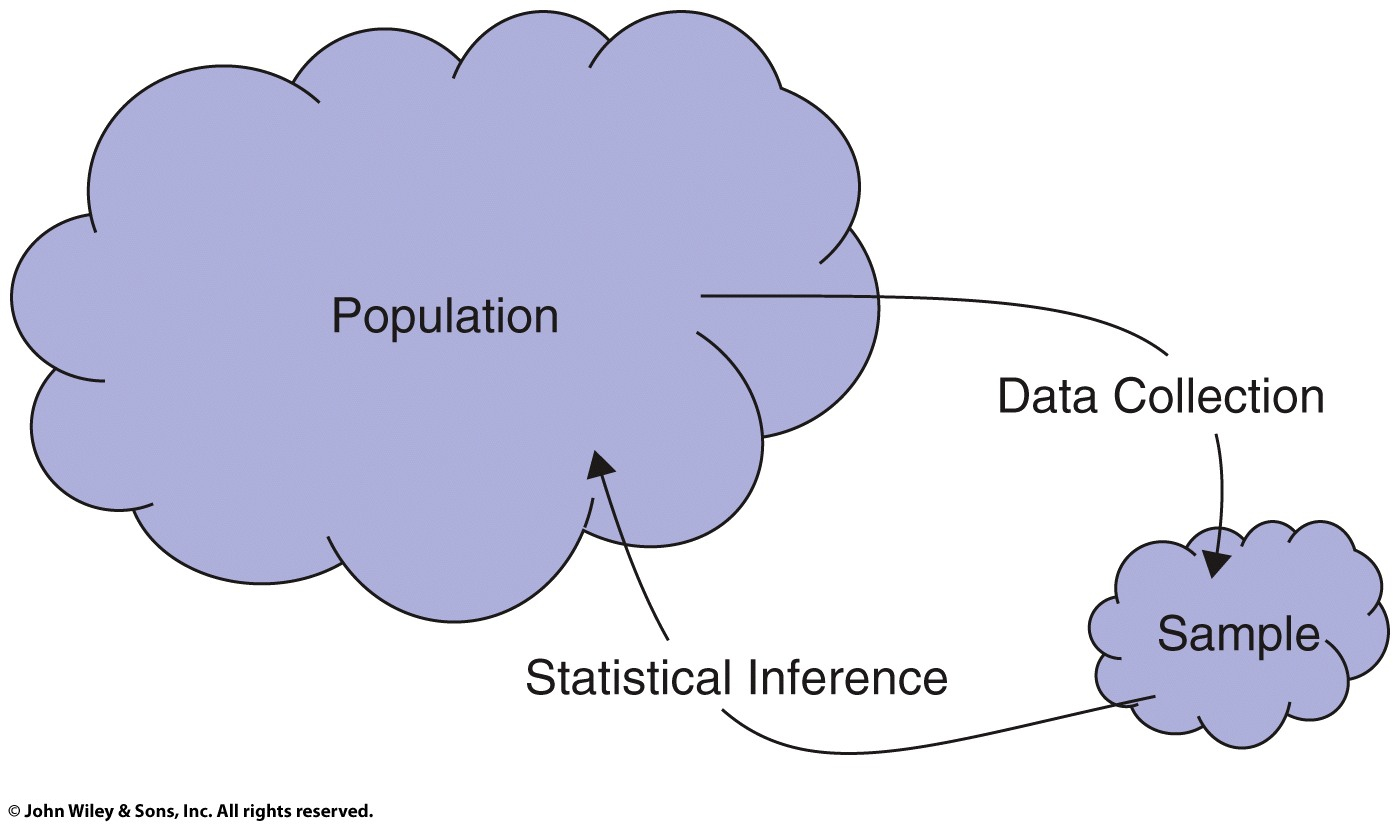
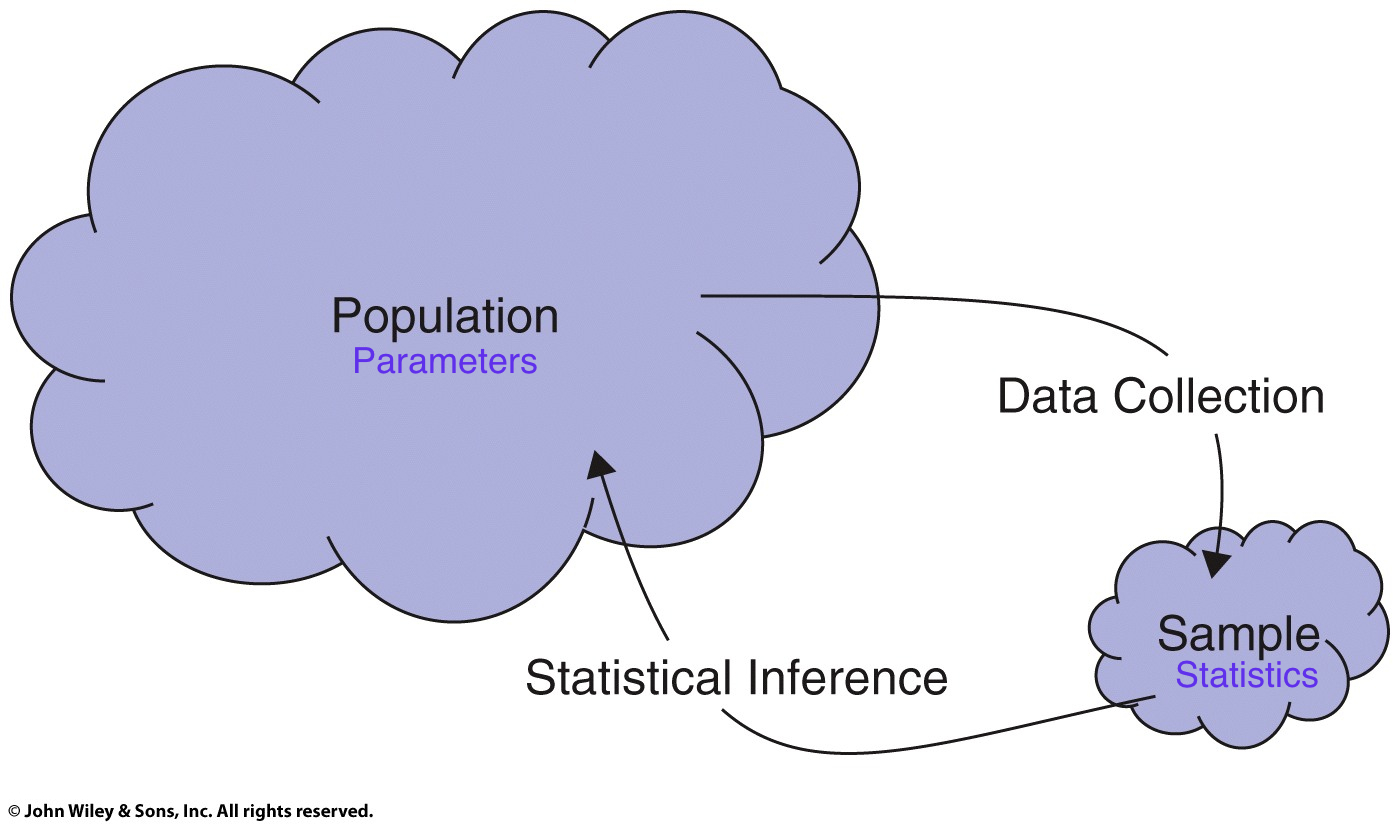
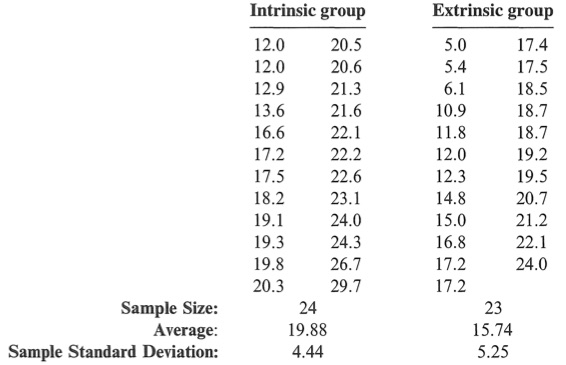
class: center, middle, inverse, title-slide # POL90: Applied Quantitative Analysis ## Chapter 1 ### Prof Wasow <br/> Assistant Professor, Politics <br/> Pomona College ### 2022-01-27 --- # Announcements .large[ - PS01 on Sakai, due *Friday* + Complete at least 90% of datacamp for full credit + Complete all other assignments in RStudio, not Word + Download Rmd from Sakai -> Assignments + Upload Rmd and pdf to Gradescope + Problem sets can be completed on teams of 2 ] -- .large[ - PS02 Reporting with R Markdown https://www.datacamp.com/courses/reporting-with-rmarkdown ] -- .large[ - Read Statistical Sleuth, Chapter 1 ] --- # Schedule <table> <thead> <tr> <th style="text-align:right;"> Week </th> <th style="text-align:left;"> Date </th> <th style="text-align:left;"> Day </th> <th style="text-align:left;"> Title </th> <th style="text-align:right;"> Chapter </th> </tr> </thead> <tbody> <tr> <td style="text-align:right;"> 1 </td> <td style="text-align:left;"> Jan 17 </td> <td style="text-align:left;"> Mon </td> <td style="text-align:left;"> Introduction and Overview </td> <td style="text-align:right;"> - </td> </tr> <tr> <td style="text-align:right;"> 1 </td> <td style="text-align:left;"> Jan 19 </td> <td style="text-align:left;"> Wed </td> <td style="text-align:left;"> Introduction </td> <td style="text-align:right;"> - </td> </tr> <tr> <td style="text-align:right;"> 2 </td> <td style="text-align:left;"> Jan 24 </td> <td style="text-align:left;"> Mon </td> <td style="text-align:left;"> Drawing Statistical Conclusions </td> <td style="text-align:right;"> 1 </td> </tr> <tr> <td style="text-align:right;color: black !important;background-color: yellow !important;"> 2 </td> <td style="text-align:left;color: black !important;background-color: yellow !important;"> Jan 26 </td> <td style="text-align:left;color: black !important;background-color: yellow !important;"> Wed </td> <td style="text-align:left;color: black !important;background-color: yellow !important;"> Drawing Statistical Conclusions </td> <td style="text-align:right;color: black !important;background-color: yellow !important;"> 1 </td> </tr> <tr> <td style="text-align:right;"> 3 </td> <td style="text-align:left;"> Jan 31 </td> <td style="text-align:left;"> Mon </td> <td style="text-align:left;"> Inference Using t-Distributions </td> <td style="text-align:right;"> 2 </td> </tr> <tr> <td style="text-align:right;"> 3 </td> <td style="text-align:left;"> Feb 2 </td> <td style="text-align:left;"> Wed </td> <td style="text-align:left;"> Inference Using t-Distributions </td> <td style="text-align:right;"> 2 </td> </tr> <tr> <td style="text-align:right;"> 4 </td> <td style="text-align:left;"> Feb 7 </td> <td style="text-align:left;"> Mon </td> <td style="text-align:left;"> A Closer Look at Assumptions </td> <td style="text-align:right;"> 3 </td> </tr> <tr> <td style="text-align:right;"> 4 </td> <td style="text-align:left;"> Feb 9 </td> <td style="text-align:left;"> Wed </td> <td style="text-align:left;"> A Closer Look at Assumptions </td> <td style="text-align:right;"> 3 </td> </tr> <tr> <td style="text-align:right;"> 5 </td> <td style="text-align:left;"> Feb 14 </td> <td style="text-align:left;"> Mon </td> <td style="text-align:left;"> Alternatives to the t-Tools </td> <td style="text-align:right;"> 4 </td> </tr> <tr> <td style="text-align:right;"> 5 </td> <td style="text-align:left;"> Feb 16 </td> <td style="text-align:left;"> Wed </td> <td style="text-align:left;"> Alternatives to the t-Tools </td> <td style="text-align:right;"> 4 </td> </tr> </tbody> </table> --- # Ed Question: Loading data? <img src="images/edstem_load_data.png" width="75%" style="display: block; margin: auto;" /> --- # Ed Question: Where to code? <img src="images/edstem_where_to_code.png" width="75%" style="display: block; margin: auto;" /> --- # Intro to R Markdown <img src="images/rmarkdown_layout.png" width="85%" style="display: block; margin: auto;" /> --- # Ed Question: Random sampling vs assignment? <img src="images/edstem_screenshot2.png" width="90%" style="display: block; margin: auto;" /> --- class: center, middle, inverse # Statistics & Randomness --- .center[] .footnote[Source: http://www.stat.harvard.edu/Academics/invitation_chair_txt.html] --- # Statistics and randomness <br/> <br/> .Large[ “Here, the word randomness is what brings statistics and statisticians into the picture. <span style="color:darkred">Statistics, in a nutshell, is a discipline that studies the best ways of dealing with randomness</span>, or more precisely and broadly, variation.” <br/> - Professor Xiao-Li Meng <br/> Whipple V. N. Jones Professor of Statistics <br/> Department Chair Harvard University <br/> ] .footnote[Source: http://www.stat.harvard.edu/Academics/invitation_chair_txt.html] --- class: center, middle, inverse # Two Kinds of Randomness --- ## Statistical inferences permitted by study designs <img src="images/randomization_selection_assignment.jpg" width="90%" /> .pull-right[ .footnote[Source: *Statistical Sleuth*, Display 1.5] ] --- class: center, middle, inverse # First: Random Sampling --- ## Statistical inferences permitted by study designs <img src="images/randomization_selection_assignment2.png" width="90%" /> .pull-right[ .footnote[Source: *Statistical Sleuth*, Display 1.5] ] --- class: top # Populations & samples .center[] --- class: center background-image: url("images/fish_pond.jpg") --- # Random Sampling: Fish story <br/><br/> -- .large[ - Imagine we wanted to know the average weight of fish in a lake ] -- .large[ - We could drain the lake and weigh every fish ] -- .large[ - We could also catch and weigh a sample of 100 fish from random spots around lake ] -- .large[ - With statistics, we can use limited samples to make statements about larger population with measures of uncertainty ] -- .large[ - In reality, we never know true population <span style="color:red">parameters</span> but we can estimate sample <span style="color:red">statistics</span> ] --- # Population parameters & sample statistics .center[] ??? Statistical inference is the process of drawing conclusions about the entire population based on information in a sample. --- class: center, middle, inverse # Second: Random Assignment --- ## Statistical inferences permitted by study designs <img src="images/randomization_selection_assignment3.png" width="90%" /> .pull-right[ .footnote[Source: *Statistical Sleuth*, Display 1.5] ] --- # Recall Amabile (1985) <img src="images/amabile_1985_motivation_abstract.png" width="100%" style="display: block; margin: auto;" /> --- # How do we study creativity? -- .large[ - Research design: - Subjects with creative writing experience randomly assigned: - 24 to "Intrinsic" - 23 to "Extrinsic" ] -- .large[ - After questionnaire, subjects asked to write a "Haiku about laughter" ] -- .large[ - Poems submitted to 12 poets, who rated them on 40-point scale of creativity ] -- .large[ - Score is average of 12 judges (who did not know purpose of study) ] --- # Example: Creativity study questions <img src="images/creativity_study_questions.jpg" width="65%" style="display: block; margin: auto;" /> .footnote[Source: *Statistical Sleuth*, Display 1.2] --- # Random assignment study with two groups <br/><br/> .center[] .footnote[Source: *Statistical Sleuth*, Display 1.6] --- # Creativity study summary statistics <br/> <br/> .center[] .footnote[Source: *Statistical Sleuth*, Display 1.1] --- # Loading Creativity Experiment Data ```r library(Sleuth2) library(janitor) creativity <- Sleuth2::case0101 head(creativity) ``` ``` ## Score Treatment ## 1 5.0 Extrinsic ## 2 5.4 Extrinsic ## 3 6.1 Extrinsic ## 4 10.9 Extrinsic ## 5 11.8 Extrinsic ## 6 12.0 Extrinsic ``` ```r creativity <- creativity %>% janitor::clean_names() head(creativity, 2) ``` ``` ## score treatment ## 1 5.0 Extrinsic ## 2 5.4 Extrinsic ``` --- ## Creativity Summary Stats in Base R ```r # Base R intrin <- creativity[creativity$treatment == "Intrinsic", ] head(intrin, 3) ``` ``` ## score treatment ## 24 12.0 Intrinsic ## 25 12.0 Intrinsic ## 26 12.9 Intrinsic ``` ```r extrin <- creativity[creativity$treatment == "Extrinsic", ] head(extrin, 3) ``` ``` ## score treatment ## 1 5.0 Extrinsic ## 2 5.4 Extrinsic ## 3 6.1 Extrinsic ``` ```r int_mean <- mean(intrin$score) ext_mean <- mean(extrin$score) int_mean - ext_mean ``` ``` ## [1] 4.144203 ``` --- class: center, middle, inverse # Randomization Test --- # Randomization Distribution .large[ - Assume you are a skeptical statistician - The randomization distribution shows what types of statistics would be observed, just by random chance, if the null hypothesis were true - A randomization distribution simulates samples assuming the null hypothesis is true - A randomization distribution is centered at the value of the parameter given in the null hypothesis. ] --- # Key Question .large[ - Today’s Question: How do we measure how unusual a sample statistic is, if `\(H_0\)` is true? - If it is very unusual, we have statistically significant evidence against the null hypothesis ] --- # Creativity study hypothesis test <br/> <br/> -- .large[ - Is a difference in means of 4.14 big or small? ] -- .large[ - A `\(p\)`-value is a measure that helps us gauge whether a result is extreme ] -- .large[ - `\(p\)`-value is the probability of getting a statistic as extreme as the observed statistic if the null hypothesis is true - What kinds of statistics would we get, if the null hypothesis is true? - How extreme is the observed statistic? ] --- class: center, middle, inverse # Randomization Tests in R --- ## Introducing `sample` ```r fake_data <- 1:10 fake_data ``` ``` ## [1] 1 2 3 4 5 6 7 8 9 10 ``` ```r sample(fake_data) ``` ``` ## [1] 10 6 5 4 1 8 2 7 9 3 ``` ```r sample(fake_data) ``` ``` ## [1] 10 6 7 9 4 8 5 1 2 3 ``` ```r sample(fake_data) ``` ``` ## [1] 8 3 4 7 5 2 1 6 9 10 ``` ```r sample(fake_data) ``` ``` ## [1] 8 4 10 9 3 1 6 2 7 5 ``` --- ## Imagine a small version of creativity study ```r cr_small ``` ``` ## score treatment names ## 37 20.6 Intrinsic Stephen ## 43 23.1 Intrinsic Seth ## 44 24.0 Intrinsic Cole ## 40 22.1 Intrinsic Bryan ## 33 19.3 Intrinsic Tyler ## 4 10.9 Extrinsic Ruby ## 19 19.5 Extrinsic Shaina ## 9 15.0 Extrinsic Gloria ## 17 18.7 Extrinsic Ashlee ## 6 12.0 Extrinsic Angela ``` ```r cr_small %>% group_by(treatment) %>% summarize(mean = mean(score)) ``` ``` ## # A tibble: 2 × 2 ## treatment mean ## <fct> <dbl> ## 1 Extrinsic 15.2 ## 2 Intrinsic 21.8 ``` --- ## What happens when we sample? ```r cr_small2 <- cr_small %>% mutate(treat2 = sample(treatment)) %>% arrange(desc(treat2)) cr_small2 ``` ``` ## score treatment names treat2 ## 37 20.6 Intrinsic Stephen Intrinsic ## 40 22.1 Intrinsic Bryan Intrinsic ## 4 10.9 Extrinsic Ruby Intrinsic ## 9 15.0 Extrinsic Gloria Intrinsic ## 6 12.0 Extrinsic Angela Intrinsic ## 43 23.1 Intrinsic Seth Extrinsic ## 44 24.0 Intrinsic Cole Extrinsic ## 33 19.3 Intrinsic Tyler Extrinsic ## 19 19.5 Extrinsic Shaina Extrinsic ## 17 18.7 Extrinsic Ashlee Extrinsic ``` ```r cr_small2 %>% group_by(treat2) %>% summarize(mean = mean(score)) ``` ``` ## # A tibble: 2 × 2 ## treat2 mean ## <fct> <dbl> ## 1 Extrinsic 20.9 ## 2 Intrinsic 16.1 ``` --- ## What happens when we sample? ```r cr_small2 <- cr_small %>% mutate(treat2 = sample(treatment)) %>% arrange(desc(treat2)) cr_small2 ``` ``` ## score treatment names treat2 ## 37 20.6 Intrinsic Stephen Intrinsic ## 33 19.3 Intrinsic Tyler Intrinsic ## 4 10.9 Extrinsic Ruby Intrinsic ## 17 18.7 Extrinsic Ashlee Intrinsic ## 6 12.0 Extrinsic Angela Intrinsic ## 43 23.1 Intrinsic Seth Extrinsic ## 44 24.0 Intrinsic Cole Extrinsic ## 40 22.1 Intrinsic Bryan Extrinsic ## 19 19.5 Extrinsic Shaina Extrinsic ## 9 15.0 Extrinsic Gloria Extrinsic ``` ```r cr_small2 %>% group_by(treat2) %>% summarize(mean = mean(score)) ``` ``` ## # A tibble: 2 × 2 ## treat2 mean ## <fct> <dbl> ## 1 Extrinsic 20.7 ## 2 Intrinsic 16.3 ``` --- ## What happens when we sample? ```r cr_small2 <- cr_small %>% mutate(treat2 = sample(treatment)) %>% arrange(desc(treat2)) cr_small2 ``` ``` ## score treatment names treat2 ## 43 23.1 Intrinsic Seth Intrinsic ## 44 24.0 Intrinsic Cole Intrinsic ## 33 19.3 Intrinsic Tyler Intrinsic ## 19 19.5 Extrinsic Shaina Intrinsic ## 6 12.0 Extrinsic Angela Intrinsic ## 37 20.6 Intrinsic Stephen Extrinsic ## 40 22.1 Intrinsic Bryan Extrinsic ## 4 10.9 Extrinsic Ruby Extrinsic ## 9 15.0 Extrinsic Gloria Extrinsic ## 17 18.7 Extrinsic Ashlee Extrinsic ``` ```r cr_small2 %>% group_by(treat2) %>% summarize(mean = mean(score)) ``` ``` ## # A tibble: 2 × 2 ## treat2 mean ## <fct> <dbl> ## 1 Extrinsic 17.5 ## 2 Intrinsic 19.6 ``` --- # Randomizing assignment in R ```r creativity_shuffle <- creativity %>% mutate( * treat_shuffle01 = sample(treatment) # create new column ) # look at data head(creativity_shuffle, 10) ``` ``` ## score treatment treat_shuffle01 *## 1 5.0 Extrinsic Intrinsic ## 2 5.4 Extrinsic Extrinsic ## 3 6.1 Extrinsic Extrinsic ## 4 10.9 Extrinsic Extrinsic ## 5 11.8 Extrinsic Extrinsic ## 6 12.0 Extrinsic Extrinsic ## 7 12.3 Extrinsic Intrinsic ## 8 14.8 Extrinsic Extrinsic ## 9 15.0 Extrinsic Intrinsic ## 10 16.8 Extrinsic Extrinsic ``` --- # Randomizing assignment in R ```r creativity_shuffle <- creativity %>% mutate( treat_shuffle01 = sample(treatment), treat_shuffle02 = sample(treatment), treat_shuffle03 = sample(treatment) ) head(creativity_shuffle, 10) ``` ``` ## score treatment treat_shuffle01 treat_shuffle02 treat_shuffle03 ## 1 5.0 Extrinsic Extrinsic Intrinsic Extrinsic ## 2 5.4 Extrinsic Intrinsic Intrinsic Extrinsic ## 3 6.1 Extrinsic Extrinsic Intrinsic Intrinsic *## 4 10.9 Extrinsic Intrinsic Extrinsic Intrinsic ## 5 11.8 Extrinsic Intrinsic Intrinsic Intrinsic ## 6 12.0 Extrinsic Extrinsic Extrinsic Extrinsic ## 7 12.3 Extrinsic Extrinsic Extrinsic Extrinsic ## 8 14.8 Extrinsic Intrinsic Intrinsic Intrinsic ## 9 15.0 Extrinsic Extrinsic Intrinsic Intrinsic ## 10 16.8 Extrinsic Extrinsic Intrinsic Extrinsic ``` --- class: center, middle, inverse # Randomization with `infer` --- ## Randomization via `infer` with one replicate ```r library(infer) # Pipe new data to infer functions creativity_shuffled <- creativity %>% # Specify the relationship between an outcome and an explanatory variable infer::specify(score ~ treatment) %>% # Declare a null hypothesis of no relationship infer::hypothesize(null = "independence") %>% # Permute data one times. infer::generate(reps = 1, type = "permute") ``` --- ## Randomization via `infer` with one replicate .column-left[ ```r creativity %>% arrange(score) %>% head(10) ``` ``` ## score treatment ## 1 5.0 Extrinsic ## 2 5.4 Extrinsic ## 3 6.1 Extrinsic ## 4 10.9 Extrinsic ## 5 11.8 Extrinsic ## 6 12.0 Extrinsic ## 24 12.0 Intrinsic ## 25 12.0 Intrinsic ## 7 12.3 Extrinsic ## 26 12.9 Intrinsic ``` ] .column-right[ ```r creativity_shuffled %>% filter(replicate == 1) %>% arrange(score) %>% head(10) ``` ``` ## # A tibble: 10 × 3 ## # Groups: replicate [1] ## score treatment replicate ## <dbl> <fct> <int> ## 1 5 Intrinsic 1 ## 2 5.40 Intrinsic 1 ## 3 6.10 Intrinsic 1 ## 4 10.9 Extrinsic 1 ## 5 11.8 Intrinsic 1 ## 6 12 Extrinsic 1 ## 7 12 Intrinsic 1 ## 8 12 Intrinsic 1 ## 9 12.3 Intrinsic 1 ## 10 12.9 Intrinsic 1 ``` ] --- ## Randomization via `infer` with two replicates ```r library(infer) # Pipe new data to infer functions creativity_shuffled <- creativity %>% # Specify the relationship between an outcome and an explanatory variable infer::specify(score ~ treatment) %>% # Declare a null hypothesis of no relationship infer::hypothesize(null = "independence") %>% # Permute data one times. infer::generate(reps = 2, type = "permute") ``` --- ## Randomization via `infer` with two replicates .column-left[ ```r creativity_shuffled %>% filter(replicate == 1) %>% arrange(score) ``` ``` ## # A tibble: 47 × 3 ## # Groups: replicate [1] ## score treatment replicate ## <dbl> <fct> <int> ## 1 5 Intrinsic 1 ## 2 5.40 Extrinsic 1 ## 3 6.10 Extrinsic 1 ## 4 10.9 Extrinsic 1 ## 5 11.8 Extrinsic 1 ## 6 12 Intrinsic 1 ## 7 12 Intrinsic 1 ## 8 12 Intrinsic 1 ## 9 12.3 Extrinsic 1 ## 10 12.9 Intrinsic 1 ## # … with 37 more rows ``` ] .column-right[ ```r creativity_shuffled %>% filter(replicate == 2) %>% arrange(score) ``` ``` ## # A tibble: 47 × 3 ## # Groups: replicate [1] ## score treatment replicate ## <dbl> <fct> <int> ## 1 5 Extrinsic 2 ## 2 5.40 Extrinsic 2 ## 3 6.10 Intrinsic 2 ## 4 10.9 Intrinsic 2 ## 5 11.8 Intrinsic 2 ## 6 12 Extrinsic 2 ## 7 12 Extrinsic 2 ## 8 12 Extrinsic 2 ## 9 12.3 Intrinsic 2 ## 10 12.9 Intrinsic 2 ## # … with 37 more rows ``` ] --- ## Randomization via `infer` with 1000 replicates ```r library(infer) # Pipe new data to infer functions creativity_shuffled <- creativity %>% # Specify the relationship between an outcome and an explanatory variable infer::specify(score ~ treatment) %>% # Declare a null hypothesis of no relationship infer::hypothesize(null = "independence") %>% # Permute data 1000 times. infer::generate(reps = 1000, type = "permute") %>% * # Calculate the difference-in-means for our permuted dataset infer::calculate(stat = "diff in means", order = c("Intrinsic", "Extrinsic")) ``` --- ## View `creativity_shuffled` ```r head(creativity_shuffled, 10) ``` ``` ## Response: score (numeric) ## Explanatory: treatment (factor) ## Null Hypothesis: independence ## # A tibble: 10 × 2 ## replicate stat ## <int> <dbl> ## 1 1 -0.862 ## 2 2 0.832 ## 3 3 -3.64 ## 4 4 0.560 ## 5 5 1.01 ## 6 6 -1.36 ## 7 7 0.253 ## 8 8 0.696 ## 9 9 0.296 ## 10 10 1.08 ``` --- ```r library(ggplot2) infer::visualize(creativity_shuffled) + geom_vline(xintercept = c(-4.14, 4.14), col = "red") ``` <img src="week02_02_files/figure-html/unnamed-chunk-31-1.png" style="display: block; margin: auto;" /> <!-- + shade_p_value(obs_stat = 4.14, direction = "two-sided") --> --- ```r left_tail <- sum(creativity_shuffled$stat <= -4.14) right_tail <- sum(creativity_shuffled$stat >= +4.14) left_tail ``` ``` ## [1] 3 ``` ```r right_tail ``` ``` ## [1] 4 ``` ```r p <- (left_tail + right_tail) / 1000 p ``` ``` ## [1] 0.007 ``` --- class: center, middle, inverse # Randomization Tests: Exercise --- Sleep versus Caffeine - `\(\mu_s\)` and `\(\mu_c\)` are the mean number of words recalled after sleeping and after caffeine. - `\(H_0: \mu_s = \mu_c\)` - `\(H_1: \mu_s \neq \mu_c\)` --- ## Exercise: Randomization Distribution with StatKey .large[ + Go to http://www.lock5stat.com/StatKey - You can just search for StatKey on Google - Click on "Test for Difference in Means" - Click on "Leniency and Smiles" for Pop-up menu - Select "Sleep Caffeine Words" - Play with randomizing assignment to the two conditions ] --- # Questions? --- class: center, middle, inverse # Visualizing Creativity Data --- ## Boxplot ```r plot(score ~ treatment, data = creativity) ``` <img src="week02_02_files/figure-html/unnamed-chunk-33-1.png" width="60%" style="display: block; margin: auto;" /> --- ## Beeswarm Plot ```r library("ggbeeswarm") creativity %>% ggplot() + aes(x = treatment, y = score) + geom_beeswarm() ``` <img src="week02_02_files/figure-html/unnamed-chunk-34-1.png" width="55%" style="display: block; margin: auto;" /> --- ## Histogram in Base R ```r hist(creativity$score) ``` <img src="week02_02_files/figure-html/unnamed-chunk-35-1.png" width="60%" style="display: block; margin: auto;" /> --- ## Histograms in Base R .pull-left[ ```r hist(intrin$score) ``` <img src="week02_02_files/figure-html/unnamed-chunk-36-1.png" style="display: block; margin: auto;" /> ] -- .pull-right[ ```r hist(extrin$score) ``` <img src="week02_02_files/figure-html/unnamed-chunk-37-1.png" style="display: block; margin: auto;" /> ] --- ## Plot Historgrams in Base R ```r hist(intrin$score, col = rgb(0,0,1,1/4), breaks = 15, xlim = c(0,30), ylim = c(0,4)) # first histogram hist(extrin$score, col = rgb(1,0,0,1/4), breaks = 15, add = TRUE) # second histogram ``` <img src="week02_02_files/figure-html/unnamed-chunk-38-1.png" width="55%" style="display: block; margin: auto;" /> --- ## Plot Historgrams with `ggplot2` ```r creativity %>% ggplot() + aes(x = score, fill = treatment) + geom_histogram() ``` <img src="week02_02_files/figure-html/unnamed-chunk-39-1.png" style="display: block; margin: auto;" />