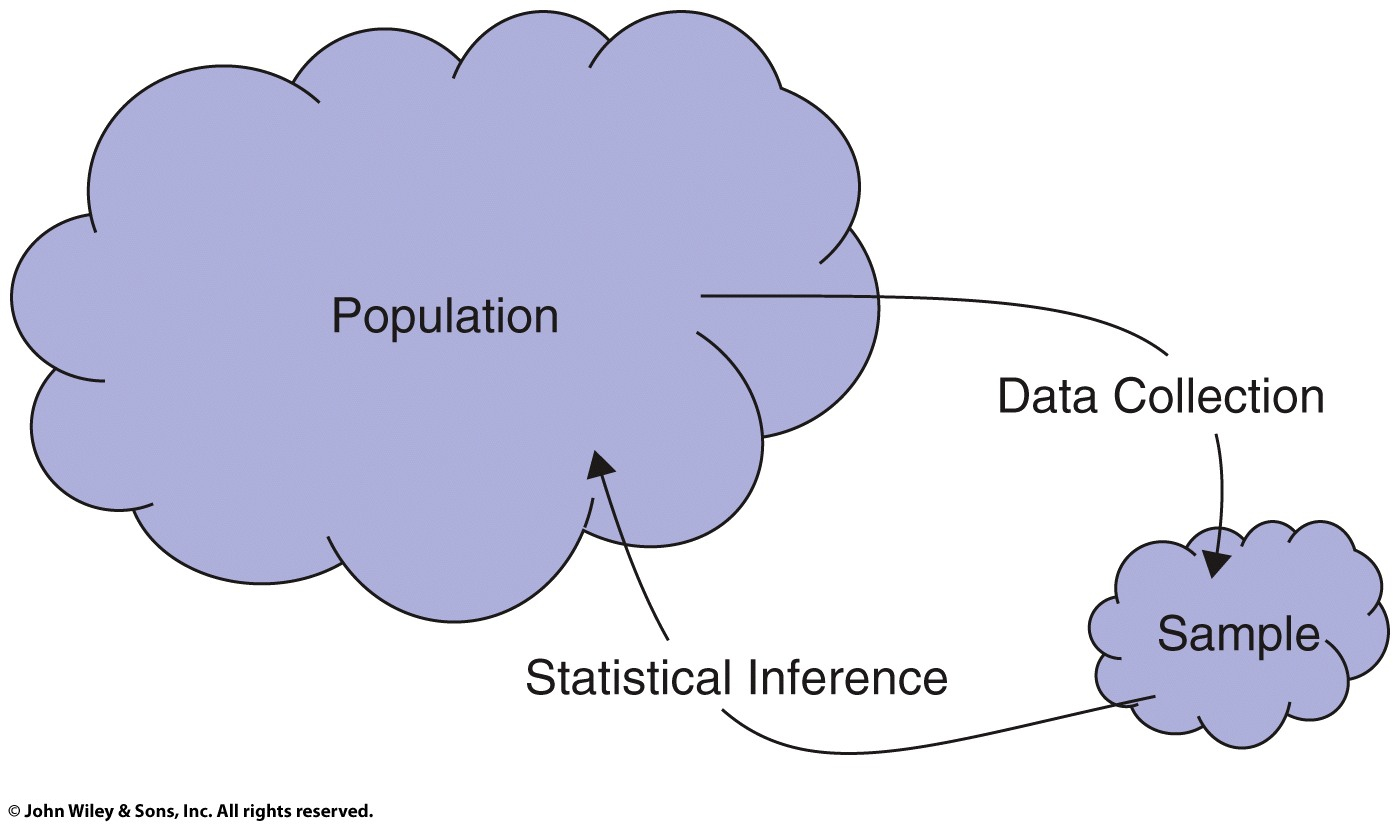
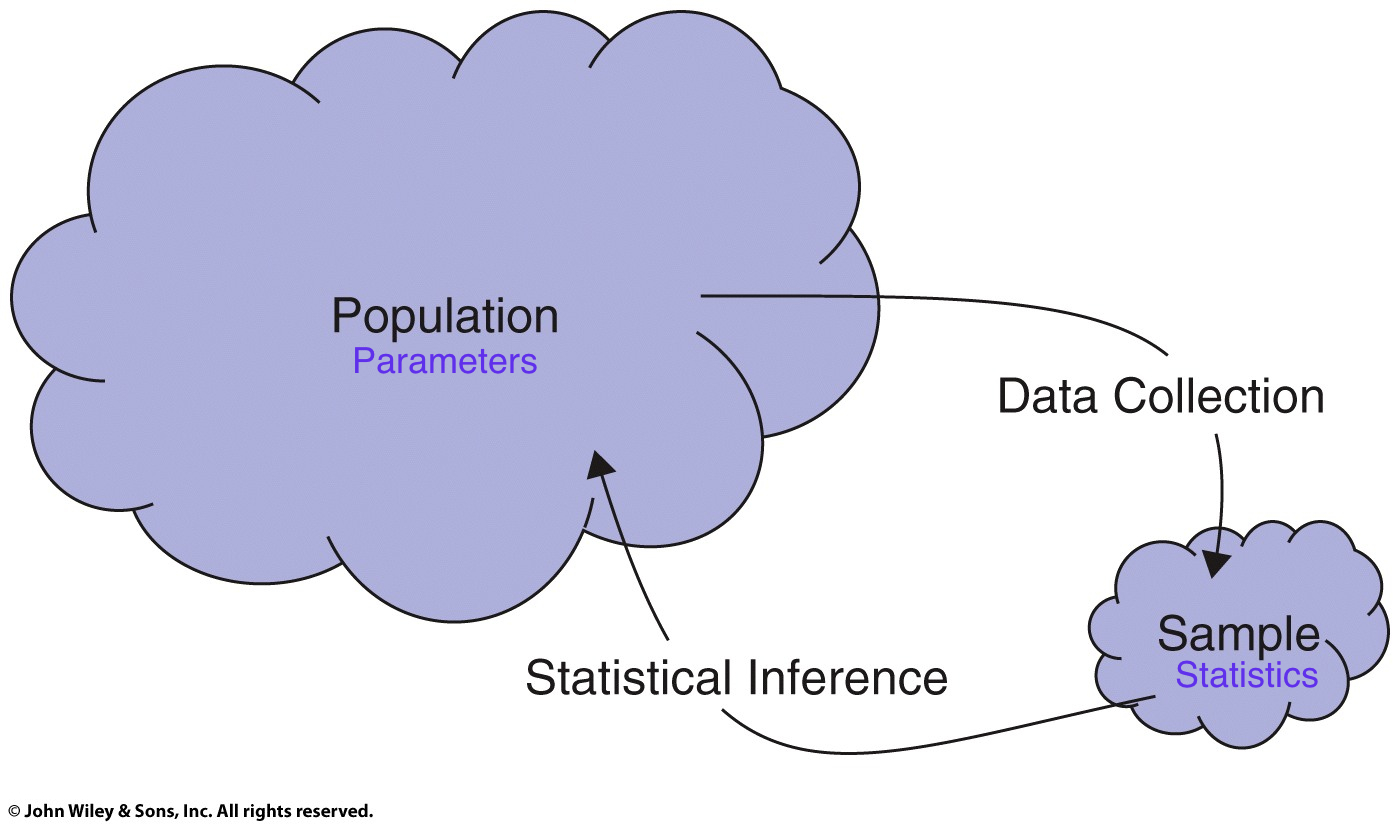
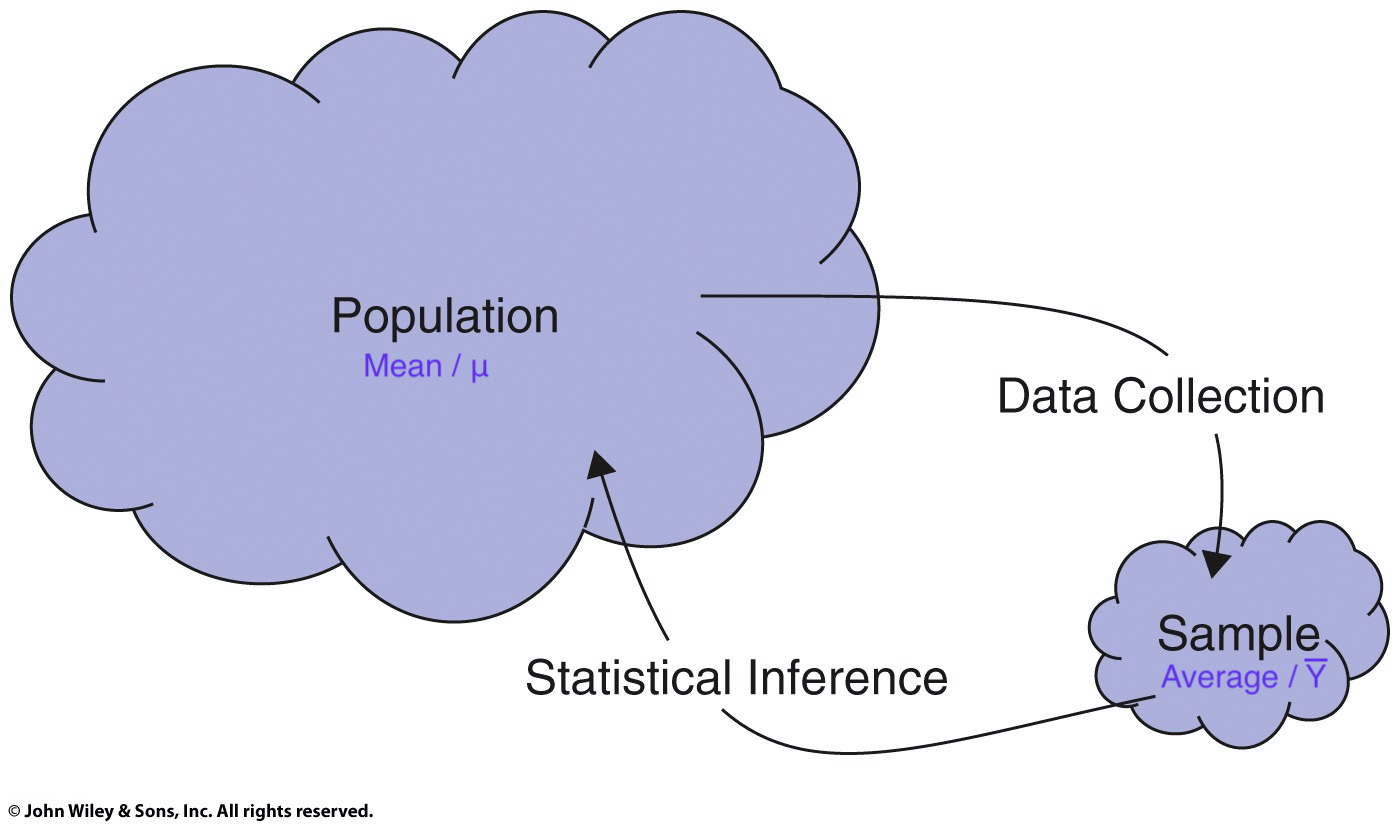
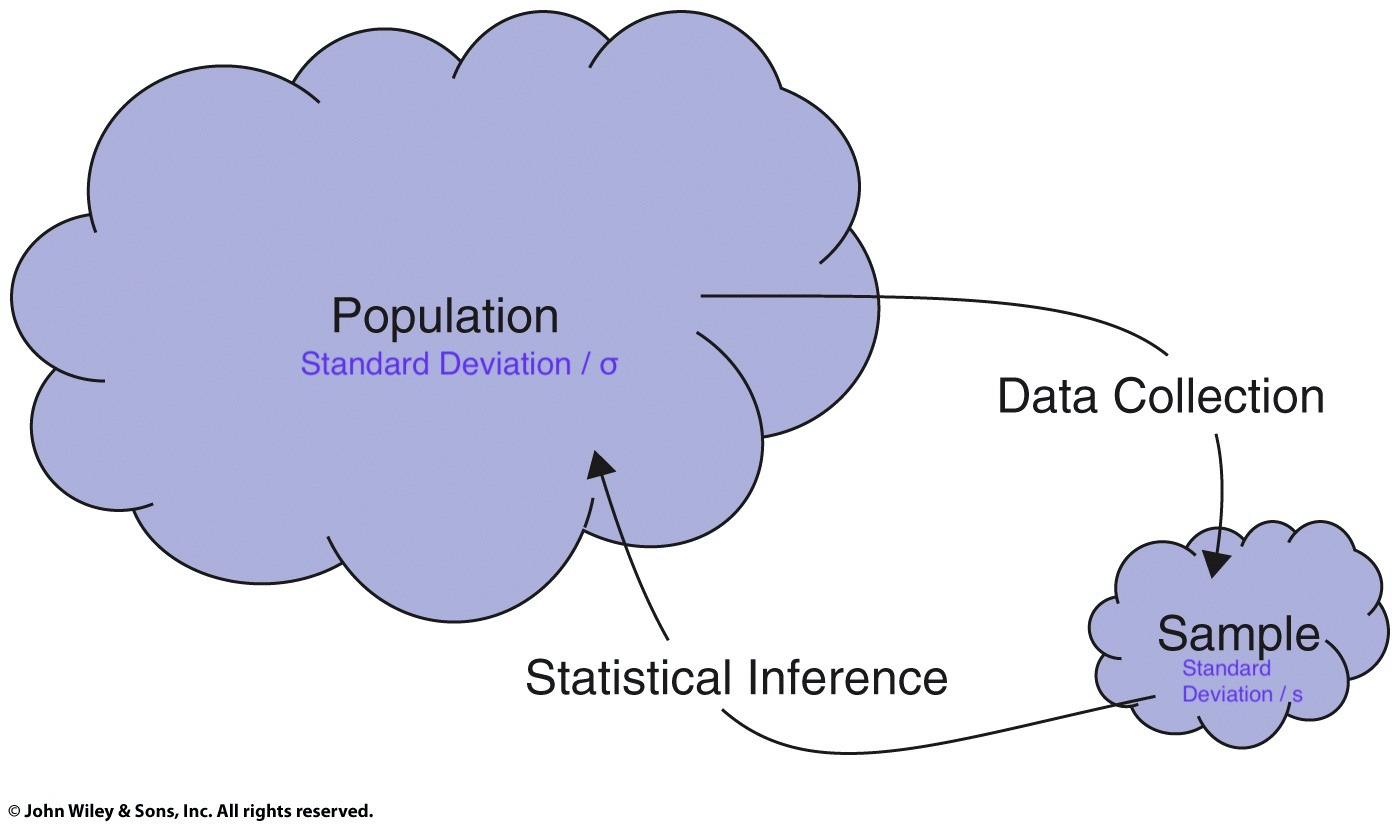
class: center, middle, inverse, title-slide # POL90: Statistics ## Chapter 2: Calculating <span class="math inline"><em>t</em></span>-statistics ### Prof Wasow<br/>Assistant Professor, Politics<br/>Pomona College ### 2022-02-07 --- ## Announcements .large[ * Assignments + PS02 due <mark>Friday, 2/4</mark> + Problem Sets can be done in teams of two <!-- + Report 1 --> <!-- + Teammates assigned (see Canvas `\(\rightarrow\)` Announcements) --> <!-- + Keep me posted if there are any issues --> <!-- + Due Tuesday 2/23 --> ] --- ## Schedule <table> <thead> <tr> <th style="text-align:right;"> Week </th> <th style="text-align:left;"> Date </th> <th style="text-align:left;"> Day </th> <th style="text-align:left;"> Title </th> <th style="text-align:right;"> Chapter </th> </tr> </thead> <tbody> <tr> <td style="text-align:right;"> 1 </td> <td style="text-align:left;"> Jan 17 </td> <td style="text-align:left;"> Mon </td> <td style="text-align:left;"> MLK Day </td> <td style="text-align:right;"> - </td> </tr> <tr> <td style="text-align:right;"> 1 </td> <td style="text-align:left;"> Jan 19 </td> <td style="text-align:left;"> Wed </td> <td style="text-align:left;"> Introduction </td> <td style="text-align:right;"> - </td> </tr> <tr> <td style="text-align:right;"> 2 </td> <td style="text-align:left;"> Jan 24 </td> <td style="text-align:left;"> Mon </td> <td style="text-align:left;"> Drawing Statistical Conclusions </td> <td style="text-align:right;"> 1 </td> </tr> <tr> <td style="text-align:right;"> 2 </td> <td style="text-align:left;"> Jan 26 </td> <td style="text-align:left;"> Wed </td> <td style="text-align:left;"> Drawing Statistical Conclusions </td> <td style="text-align:right;"> 1 </td> </tr> <tr> <td style="text-align:right;"> 3 </td> <td style="text-align:left;"> Jan 31 </td> <td style="text-align:left;"> Mon </td> <td style="text-align:left;"> Inference Using t-Distributions </td> <td style="text-align:right;"> 2 </td> </tr> <tr> <td style="text-align:right;color: black !important;background-color: yellow !important;"> 3 </td> <td style="text-align:left;color: black !important;background-color: yellow !important;"> Feb 2 </td> <td style="text-align:left;color: black !important;background-color: yellow !important;"> Wed </td> <td style="text-align:left;color: black !important;background-color: yellow !important;"> Inference Using t-Distributions </td> <td style="text-align:right;color: black !important;background-color: yellow !important;"> 2 </td> </tr> <tr> <td style="text-align:right;"> 4 </td> <td style="text-align:left;"> Feb 7 </td> <td style="text-align:left;"> Mon </td> <td style="text-align:left;"> A Closer Look at Assumptions </td> <td style="text-align:right;"> 3 </td> </tr> <tr> <td style="text-align:right;"> 4 </td> <td style="text-align:left;"> Feb 9 </td> <td style="text-align:left;"> Wed </td> <td style="text-align:left;"> A Closer Look at Assumptions </td> <td style="text-align:right;"> 3 </td> </tr> <tr> <td style="text-align:right;"> 5 </td> <td style="text-align:left;"> Feb 14 </td> <td style="text-align:left;"> Mon </td> <td style="text-align:left;"> Alternatives to the t-Tools </td> <td style="text-align:right;"> 4 </td> </tr> <tr> <td style="text-align:right;"> 5 </td> <td style="text-align:left;"> Feb 16 </td> <td style="text-align:left;"> Wed </td> <td style="text-align:left;"> Alternatives to the t-Tools </td> <td style="text-align:right;"> 4 </td> </tr> </tbody> </table> --- ## Assignment schedule <table> <thead> <tr> <th style="text-align:right;"> Week </th> <th style="text-align:left;"> Date </th> <th style="text-align:left;"> Day </th> <th style="text-align:left;"> Assignment </th> <th style="text-align:right;"> Percent </th> </tr> </thead> <tbody> <tr> <td style="text-align:right;"> 2 </td> <td style="text-align:left;"> Jan 28 </td> <td style="text-align:left;"> Fri </td> <td style="text-align:left;"> PS01 </td> <td style="text-align:right;"> 3 </td> </tr> <tr> <td style="text-align:right;color: black !important;background-color: yellow !important;"> 3 </td> <td style="text-align:left;color: black !important;background-color: yellow !important;"> Feb 4 </td> <td style="text-align:left;color: black !important;background-color: yellow !important;"> Fri </td> <td style="text-align:left;color: black !important;background-color: yellow !important;"> PS02 </td> <td style="text-align:right;color: black !important;background-color: yellow !important;"> 3 </td> </tr> <tr> <td style="text-align:right;"> 4 </td> <td style="text-align:left;"> Feb 11 </td> <td style="text-align:left;"> Fri </td> <td style="text-align:left;"> PS03 </td> <td style="text-align:right;"> 3 </td> </tr> <tr> <td style="text-align:right;"> 5 </td> <td style="text-align:left;"> Feb 18 </td> <td style="text-align:left;"> Fri </td> <td style="text-align:left;"> PS04 </td> <td style="text-align:right;"> 3 </td> </tr> <tr> <td style="text-align:right;"> 6 </td> <td style="text-align:left;"> Feb 25 </td> <td style="text-align:left;"> Fri </td> <td style="text-align:left;"> PS05 </td> <td style="text-align:right;"> 3 </td> </tr> <tr> <td style="text-align:right;"> 7 </td> <td style="text-align:left;"> Mar 4 </td> <td style="text-align:left;"> Fri </td> <td style="text-align:left;"> Report1 </td> <td style="text-align:right;"> 6 </td> </tr> <tr> <td style="text-align:right;"> 8 </td> <td style="text-align:left;"> Mar 11 </td> <td style="text-align:left;"> Fri </td> <td style="text-align:left;"> PS06 </td> <td style="text-align:right;"> 3 </td> </tr> <tr> <td style="text-align:right;"> 9 </td> <td style="text-align:left;"> Mar 18 </td> <td style="text-align:left;"> Fri </td> <td style="text-align:left;"> Spring break </td> <td style="text-align:right;"> NA </td> </tr> <tr> <td style="text-align:right;"> 10 </td> <td style="text-align:left;"> Mar 25 </td> <td style="text-align:left;"> Fri </td> <td style="text-align:left;"> PS07 </td> <td style="text-align:right;"> 3 </td> </tr> <tr> <td style="text-align:right;"> 11 </td> <td style="text-align:left;"> Apr 1 </td> <td style="text-align:left;"> Fri </td> <td style="text-align:left;"> PS08 </td> <td style="text-align:right;"> 3 </td> </tr> </tbody> </table> --- class: center, middle, inverse # Brief Intro to Tidyverse --- ## Brief intro to tidyverse .large[ - Data is like a noun, Functions are like verbs. + The “verb” operates on the “noun.” - As in, plot this data or summarize this data. + Tidyverse functions aim to use functions / verbs that are more human readable. ] <!-- For now, we won’t worry about “tibbles” except to say they’re a kind of data.frame --> --- ## One other tidyverse idea .large[ - Data first. + like cooking: data is our main ingredient + We prep it with things like `filter()` or `mutate()` and the “cook” it with functions like `lm()` or `ggplot()` + Ingredient `\(\rightarrow\)` prep `\(\rightarrow\)` cook + Data `\(\rightarrow\)` filter/mutate/select/etc `\(\rightarrow\)` analyze/visualize ] --- class: center, middle, inverse # Review of Pipes --- ## Review of pipes ```r # standard function syntax (with argument) sqrt(x = c(9, 16)) ``` ``` ## [1] 3 4 ``` ```r # standard function syntax (without argument) sqrt(c(9, 16)) ``` ``` ## [1] 3 4 ``` ```r # piped syntax (with period) c(9, 16) %>% sqrt(x = .) ``` ``` ## [1] 3 4 ``` ```r # piped syntax (without period) c(9, 16) %>% sqrt() ``` ``` ## [1] 3 4 ``` --- ## Why use period syntax? - when we write ```r t.test(mpg ~ am, mtcars) ``` - R understands each element as an argument <code class ='r hljs remark-code'>t.test(<span style='background-color:#ffff7f'>formula =</span> mpg ~ am, <span style='background-color:#ffff7f'>data =</span> mtcars)</code> ``` ## ## Welch Two Sample t-test ## ## data: mpg by am ## t = -3.7671, df = 18.332, p-value = 0.001374 ## alternative hypothesis: true difference in means between group 0 and group 1 is not equal to 0 ## 95 percent confidence interval: ## -11.280194 -3.209684 ## sample estimates: ## mean in group 0 mean in group 1 ## 17.14737 24.39231 ``` --- ## What to do with functions that aren't "data first"? - Use something like `data = .` <code class ='r hljs remark-code'>mtcars %>% t.test(formula = mpg ~ am, <span style='background-color:#ffff7f'>data = .</span>)</code> ``` ## ## Welch Two Sample t-test ## ## data: mpg by am ## t = -3.7671, df = 18.332, p-value = 0.001374 ## alternative hypothesis: true difference in means between group 0 and group 1 is not equal to 0 ## 95 percent confidence interval: ## -11.280194 -3.209684 ## sample estimates: ## mean in group 0 mean in group 1 ## 17.14737 24.39231 ``` --- ## Review of pipes ```r # line by line sum_out <- sum(c(9, 16)) sqrt_out <- sqrt(sum_out) sqrt_out ``` ``` ## [1] 5 ``` ```r # inside-out sqrt(sum(c(9, 16))) ``` ``` ## [1] 5 ``` ```r # piped c(9, 16) %>% sum() %>% sqrt() ``` ``` ## [1] 5 ``` --- ## Why pipes? (Optional) <img src="images/andrew_heiss_pipes_example.jpg" width="100%" style="display: block; margin: auto;" /> --- ## What is `clean_names()` and `snake_case`? <img src="images/coding_cases.png" width="100%" style="display: block; margin: auto;" /> .footnote[Artwork by @allison_horst] --- class: center, middle, inverse # Chapter 2: Schizophrenia study --- ## Chapter 2: Schizophrenia study .large[ * Data: - 15 pairs of monozygotic twins, where one of the twins was schizophrenic and the other was not, were located in Canada and the U.S. The researchers used magnetic resonance imaging to measure the volumes of the left hippocampus. * Research questions: - What is the magnitude of the differences in volumes of the left hippocampus between the unaffected and the affected individuals? Is the discrepancy in hippocampus volumes greater than can be explained by chance? ] --- ## Schizophrenia study <img src="images/ss_display_2_2.png" width="100%" style="display: block; margin: auto;" /> .footnote[Source: Statistical Sleuth 3e, Display 2.2] --- ## Structure? Paired. <img src="images/ss_display_2_2_modified.png" width="100%" style="display: block; margin: auto;" /> .footnote[Source: Statistical Sleuth 3e, Display 2.2] --- ## Sample is difference <img src="images/ss_display_2_2_modified2.png" width="100%" style="display: block; margin: auto;" /> .footnote[Source: Statistical Sleuth 3e, Display 2.2] --- ## Interpreting the Stem-and-leaf plot <img src="images/ss_display_2_2_modified3.png" width="100%" style="display: block; margin: auto;" /> .footnote[Source: Statistical Sleuth 3e, Display 2.2] --- class: center, middle, inverse # Schizophrenia Study # `\(t\)`-test in R --- ## Load `twins` data ```r twins <- Sleuth3::case0202 %>% janitor::clean_names() twins ``` ``` ## unaffected affected ## 1 1.94 1.27 ## 2 1.44 1.63 ## 3 1.56 1.47 ## 4 1.58 1.39 ## 5 2.06 1.93 ## 6 1.66 1.26 ## 7 1.75 1.71 ## 8 1.77 1.67 ## 9 1.78 1.28 ## 10 1.92 1.85 ## 11 1.25 1.02 ## 12 1.93 1.34 ## 13 2.04 2.02 ## 14 1.62 1.59 ## 15 2.08 1.97 ``` --- ## Calculate difference ```r twins$difference <- twins$unaffected - twins$affected twins ``` ``` ## unaffected affected difference ## 1 1.94 1.27 0.67 ## 2 1.44 1.63 -0.19 ## 3 1.56 1.47 0.09 ## 4 1.58 1.39 0.19 ## 5 2.06 1.93 0.13 ## 6 1.66 1.26 0.40 ## 7 1.75 1.71 0.04 ## 8 1.77 1.67 0.10 ## 9 1.78 1.28 0.50 ## 10 1.92 1.85 0.07 ## 11 1.25 1.02 0.23 ## 12 1.93 1.34 0.59 ## 13 2.04 2.02 0.02 ## 14 1.62 1.59 0.03 ## 15 2.08 1.97 0.11 ``` --- ## Calculating t.test (one vector, difference) ```r *t.test(twins$difference) ``` ``` ## ## One Sample t-test ## ## data: twins$difference *## t = 3.2289, df = 14, p-value = 0.006062 ## alternative hypothesis: true mean is not equal to 0 ## 95 percent confidence interval: ## 0.0667041 0.3306292 ## sample estimates: ## mean of x ## 0.1986667 ``` --- ## Calculating t.test (two vectors, paired) ```r *t.test(twins$unaffected, twins$affected, paired = TRUE) ``` ``` ## ## Paired t-test ## ## data: twins$unaffected and twins$affected *## t = 3.2289, df = 14, p-value = 0.006062 ## alternative hypothesis: true difference in means is not equal to 0 ## 95 percent confidence interval: ## 0.0667041 0.3306292 ## sample estimates: ## mean of the differences ## 0.1986667 ``` --- class: center, middle, inverse # Schizophrenia study # by visualization --- ## Visualize `twins` data ```r plot(unaffected ~ affected, data = twins) ``` <img src="week03_02_files/figure-html/unnamed-chunk-20-1.png" width="60%" style="display: block; margin: auto;" /> --- ## Schizophrenia study: `ggplot2` plot .left-code[ ```r library(ggplot2) tidy_twins %>% ggplot() + aes(x = condition, y = area, color = twin_pair, group = twin_pair) + geom_point() + geom_line() ``` ] .right-plot[ <img src="week03_02_files/figure-html/twins-plot-out-1.png" width="100%" style="display: block; margin: auto;" /> ] --- class: center, middle, inverse # Schizophrenia study # hypothesis test by randomization --- ## Sampling Distribution of the Sample Average <img src="images/ss_display_2_3.png" width="60%" style="display: block; margin: auto;" /> .footnote[Source: Statistical Sleuth 3e, Display 2.3] --- ## Randomization test for single mean <img src="images/statkey_twins_randomization.png" width="90%" style="display: block; margin: auto;" /> --- ## Sampling Distribution `\(\neq\)` Population Distribution <img src="images/ss_display_2_3.png" width="60%" style="display: block; margin: auto;" /> .footnote[Source: Statistical Sleuth 3e, Display 2.3] --- class: center, middle, inverse # Schizophrenia study # `\(t\)`-test by formula --- ## *t*-ratio or *t*-statistic .vertical-center[ <img src="images/t-ratio_formula.png" width="100%" style="display: block; margin: auto;" /> ] --- ## *t*-ratio or *t*-statistic .vertical-center[ <img src="images/t-ratio_formula_mod01.png" width="100%" style="display: block; margin: auto;" /> ] --- ## *t*-ratio or *t*-statistic .vertical-center[ <img src="images/t-ratio_formula_mod02.png" width="100%" style="display: block; margin: auto;" /> ] --- ## *t*-ratio or *t*-statistic .vertical-center[ <img src="images/t-ratio_formula_mod03.png" width="100%" style="display: block; margin: auto;" /> ] --- ## Standard Error for a Sample Average .vertical-center[ `\begin{aligned} \text{SE}(\bar{Y})&=\dfrac{s}{\sqrt{n}}\newline \newline s & = \text{sample standard deviation} \end{aligned}` ] --- ## Calculating Sample Standard Deviation .vertical-center[ $$ `\begin{aligned} \text{Sample SD}&=\sqrt{\frac{\sum_{i=1}^{n}(Y_i - \bar{Y})^2}{(n - 1)}}\newline \text{s}&=\sqrt{\frac{\sum_{i=1}^{n}(Y_i - 0.199)^2}{(15 - 1)} }\newline &=\sqrt{\frac{0.795}{(14)} }\newline &=0.238 \end{aligned}` $$ ] --- ## Developing an intuition for SD $$ `\begin{aligned} \text{Sample SD}&=\sqrt{\frac{\sum_{i=1}^{n}(Y_i - \bar{Y})^2}{(n - 1)}} \end{aligned}` $$ - SD can be understood as a kind of weighted average - Average is sum in numerator, count in denominator -- - This is similar but we're squaring the numerator, why? -- - First like taking absolute value, makes everything positive - Second, up-weights big deviations -- - Denominator has n-1, why not n? "Pay" a price for mean - Will cover more with degrees of freedom --- ## Standard Error for a Sample Average .vertical-center[ $$ `\begin{aligned} \text{SE}(\bar{Y})&=\dfrac{s}{\sqrt{n}}\newline &=\dfrac{0.238}{\sqrt{15}}\newline &=\dfrac{0.238}{3.87}\newline &=0.0615\newline \end{aligned}` $$ ] --- ## *t*-ratio or *t*-statistic .vertical-center[ $$ t\text{-ratio} = \dfrac{\text{Estimate}-\text{Parameter}}{\text{SE(Estimate)}} $$ ] --- ## *t*-Ratio in Schizophrenia Study .vertical-center[ $$ `\begin{equation} t-\text{ratio}(\text{if } \mu \text{ is zero}) = \dfrac{0.199-0}{0.0615}=3.236 \end{equation}` $$ ] --- ## Visualizing *t*-Ratio on *t*-distribution ```r visualize::visualize.t(stat = c(-3.23, 3.23), df = 14, section = "tails") ``` <img src="week03_02_files/figure-html/unnamed-chunk-30-1.png" width="60%" style="display: block; margin: auto;" /> --- class: middle, inverse, center # Calculating Sample # Standard Deviation in R --- ## Calculating Sample Standard Deviation in R ```r n <- length(twins$difference) n ``` ``` ## [1] 15 ``` ```r sample_average <- mean(twins$difference) sample_average ``` ``` ## [1] 0.1986667 ``` --- ## Calculating Sample Standard Deviation in R ```r deviation <- twins$difference - sample_average deviation ``` ``` ## [1] 0.471333333 -0.388666667 -0.108666667 -0.008666667 -0.068666667 ## [6] 0.201333333 -0.158666667 -0.098666667 0.301333333 -0.128666667 ## [11] 0.031333333 0.391333333 -0.178666667 -0.168666667 -0.088666667 ``` ```r deviation_sq <- deviation^2 deviation_sq ``` ``` ## [1] 2.221551e-01 1.510618e-01 1.180844e-02 7.511111e-05 4.715111e-03 ## [6] 4.053511e-02 2.517511e-02 9.735111e-03 9.080178e-02 1.655511e-02 ## [11] 9.817778e-04 1.531418e-01 3.192178e-02 2.844844e-02 7.861778e-03 ``` --- ## Calculating Sample Standard Deviation in R ```r data.frame( twin_diff = twins$difference, sample_average = sample_average, deviation = deviation, deviation_sq = deviation^2 ) %>% round(3) ``` ``` ## twin_diff sample_average deviation deviation_sq ## 1 0.67 0.199 0.471 0.222 ## 2 -0.19 0.199 -0.389 0.151 ## 3 0.09 0.199 -0.109 0.012 ## 4 0.19 0.199 -0.009 0.000 ## 5 0.13 0.199 -0.069 0.005 ## 6 0.40 0.199 0.201 0.041 ## 7 0.04 0.199 -0.159 0.025 ## 8 0.10 0.199 -0.099 0.010 ## 9 0.50 0.199 0.301 0.091 ## 10 0.07 0.199 -0.129 0.017 ## 11 0.23 0.199 0.031 0.001 ## 12 0.59 0.199 0.391 0.153 ## 13 0.02 0.199 -0.179 0.032 ## 14 0.03 0.199 -0.169 0.028 ## 15 0.11 0.199 -0.089 0.008 ``` --- ## Calculating Sample Standard Deviation in R ```r sum_squared_deviations <- sum(deviation_sq) sum_squared_deviations ``` ``` ## [1] 0.7949733 ``` ```r s <- sqrt(sum_squared_deviations/(n-1)) s ``` ``` ## [1] 0.2382935 ``` ```r # compare to sd() sd(twins$difference) ``` ``` ## [1] 0.2382935 ``` --- ## Calculating *p*-value in `R` for twin study - Code to calculate the left tail ```r # calc area under curve in left tail with t-stat of -3.23 pt(q = -3.23, df = 14) ``` ``` ## [1] 0.003024316 ``` -- - What's wrong with this code for calculating the right tail? ```r pt(q = +3.23, df = 14) ``` ``` ## [1] 0.9969757 ``` --- ## Visualizing area under curve from `\(-\infty\)` to 3.23 ```r visualize::visualize.t(stat = 3.23, df = 14, section = "lower") ``` <img src="week03_02_files/figure-html/unnamed-chunk-37-1.png" width="60%" style="display: block; margin: auto;" /> --- ## What we want is +3.23 to `\(+\infty\)` ```r visualize::visualize.t(stat = +3.23, df = 14, section = "upper") ``` <img src="week03_02_files/figure-html/unnamed-chunk-38-1.png" width="60%" style="display: block; margin: auto;" /> --- ## Remember we always go `\(-\infty\)` to `\(t\)`-statistic <img src="images/sliding_barn_door.jpg" width="60%" style="display: block; margin: auto;" /> --- ## Two-sided *p*-value from `\(t\)`-distribution ```r # use substraction: calc area to right of t-stat 1 - pt(q = 3.23, df = 14) ``` ``` ## [1] 0.003024316 ``` ```r # add left tail and right tail together pt(q = -3.23, df = 14) + (1 - pt(q = 3.23, df = 14)) ``` ``` ## [1] 0.006048633 ``` ```r # use symmetry: double left tail 2 * pt(q = -3.23, df = 14) ``` ``` ## [1] 0.006048633 ``` --- ## Two-sided *p*-value from `\(t\)`-distribution ```r # Assume we are not sure if t-stat is positive or negative. # Due to symmetry either of these calculates two-sided p-value 2 * pt(q = -abs(3.23), df = 14) ``` ``` ## [1] 0.006048633 ``` ```r 2 * (1 - pt(q = abs(3.23), df = 14)) ``` ``` ## [1] 0.006048633 ``` --- class: center, middle, inverse # Distinguishing Populations # and Samples --- ## Populations & samples .center[] --- class: center background-image: url("images/fish_pond.jpg") --- ## Population parameters & sample statistics .center[] ??? Statistical inference is the process of drawing conclusions about the entire population based on information in a sample. --- ## Population mean & sample average .center[] --- ## Population sd or `\(\sigma\)` & sample sd or `\(s\)` .center[] --- class: center, middle, inverse # Chapter 2: SD vs SE --- ## Standard Deviation vs Standard Error .large[ * SD is a measure of <mark>dispersion of the data</mark> from the mean * SE is a measure of the <mark>precision of our estimate</mark> + SE of any statistic is an estimate of the standard deviation in its sampling distribution + the best guess about the likely size of the difference between a statistic used to estimate a parameter and the parameter itself ] --- ## Population Dist. vs Sampling Dist. of the Average <img src="images/ss_display_2_4.png" width="80%" style="display: block; margin: auto;" /> .footnote[Source: Statistical Sleuth 3e, Display 2.4] --- ## Population Dist. vs Sampling Dist. of the Average <img src="images/ss_display_2_4_mod1.png" width="80%" style="display: block; margin: auto;" /> .footnote[Source: Statistical Sleuth 3e, Display 2.4] --- ## What's meant by "degrees of freedom"? .large[ * d.f.: A measure of the amount of information used to estimate variability * Number of values that are free to vary when the value of some statistic, like `\(\bar{X}\)` , is known * Example: Imagine a simple vector of data: 1, 2, 3, 4, 5 * Example: Now, take the mean: `\(\frac{1+2+3+4+5}{5} = 3\)` * Example: Can <span style="color:red">?</span> vary? `\(\frac{1+2+3+4+\color{red}{\text{?}}}{5} = 3\)` * No. With a mean and four terms, we know all the data. So, degrees of freedom is `\(n-1\)` or 4 ] --- ## Schizophrenia study .large[ * Summary of findings: - There is substantial evidence that the mean difference in left hippocampus volumes between schizophrenic individuals and their non-schizophrenic twins is non-zero (two-sided *p*-value = 0.006 from a paired *t*-test). - It's estimated the mean volume is 0.20 cm `\(^3\)` smaller for those with schizophrenia (about 11% smaller). A 95% confidence interval for the difference is from 0.07 to 0.33 cm `\(^3\)`. ] --- class: center, middle # Questions? --- class: center, middle # Tidy vs 'Messy' Data --- # "Tidy data," Wickham (2014) <img src="images/tidy_data_article.png" width="75%" style="display: block; margin: auto;" /> --- # "Tidy data," Wickham (2014) <img src="images/tidy_data_article_highlight.png" width="75%" style="display: block; margin: auto;" /> --- # "Tidy data," Wickham (2014) .vertical-center[ <img src="images/tidy_data_article_highlight_zoomed.png" width="100%" style="display: block; margin: auto;" /> ] --- # Examples of 'messy' data, Wickham (2014) .vertical-center[ <img src="images/tidy_data_article_table1_2_hires.png" width="100%" style="display: block; margin: auto;" /> ] --- # Tidied data, Wickham (2014) .vertical-center[ <img src="images/tidy_data_article_table3.png" width="100%" style="display: block; margin: auto;" /> ] --- # Twins data is 'messy' .large[ * Twin pair information implied by row number, but not in data frame * Condition of 'affected' or 'unaffected' stored in column header, but not in data frame ] ```r head(twins) ``` ``` ## unaffected affected difference *## 1 1.94 1.27 0.67 ## 2 1.44 1.63 -0.19 ## 3 1.56 1.47 0.09 ## 4 1.58 1.39 0.19 ## 5 2.06 1.93 0.13 ## 6 1.66 1.26 0.40 ``` --- # Tidy twins data with `tidyr` ```r suppressMessages(library(dplyr)) library(tidyr) # use tidyr package to `pivot_longer` to create `key value` pair tidy_twins <- twins %>% mutate(twin_pair = row_number() %>% # create pair number as.factor()) %>% # convert to categorical tidyr::pivot_longer( cols = c('affected', 'unaffected'), names_to = 'condition', values_to = 'area' ) %>% arrange(twin_pair) ``` .footnote[Source: http://appliedstats.org/chapter2.html]